Customer story · Vision AI workforce management
The right crew on the right task, seen live while the shift is running.
A project manufacturer of volumetric modular buildings connected Offsight Vision AI to its crew plan to manage its workforce in real time. In the work areas its cameras cover, it now sees live, hour by hour and in dollars, whether each area has the crew the plan calls for. No badges, no timesheet codes, no tablet taps: operators changed nothing.
- Customer
- A project manufacturer of volumetric modular buildings
- Used for
- Real-time workforce management: crew coverage against the crew plan, in hours and dollars
- Sample shown
- One framing and assembly work area, one camera, Monday to Friday
- Change for operators
- None. No badges, taps or data entry
One work area · one week
One crew against its plan, as Vision AI saw it.
Four numbers from the customer’s own Vision AI data, each with what it means. Every figure is listed in full at the end of the page.
69%
observed crew hours, as a share of planned
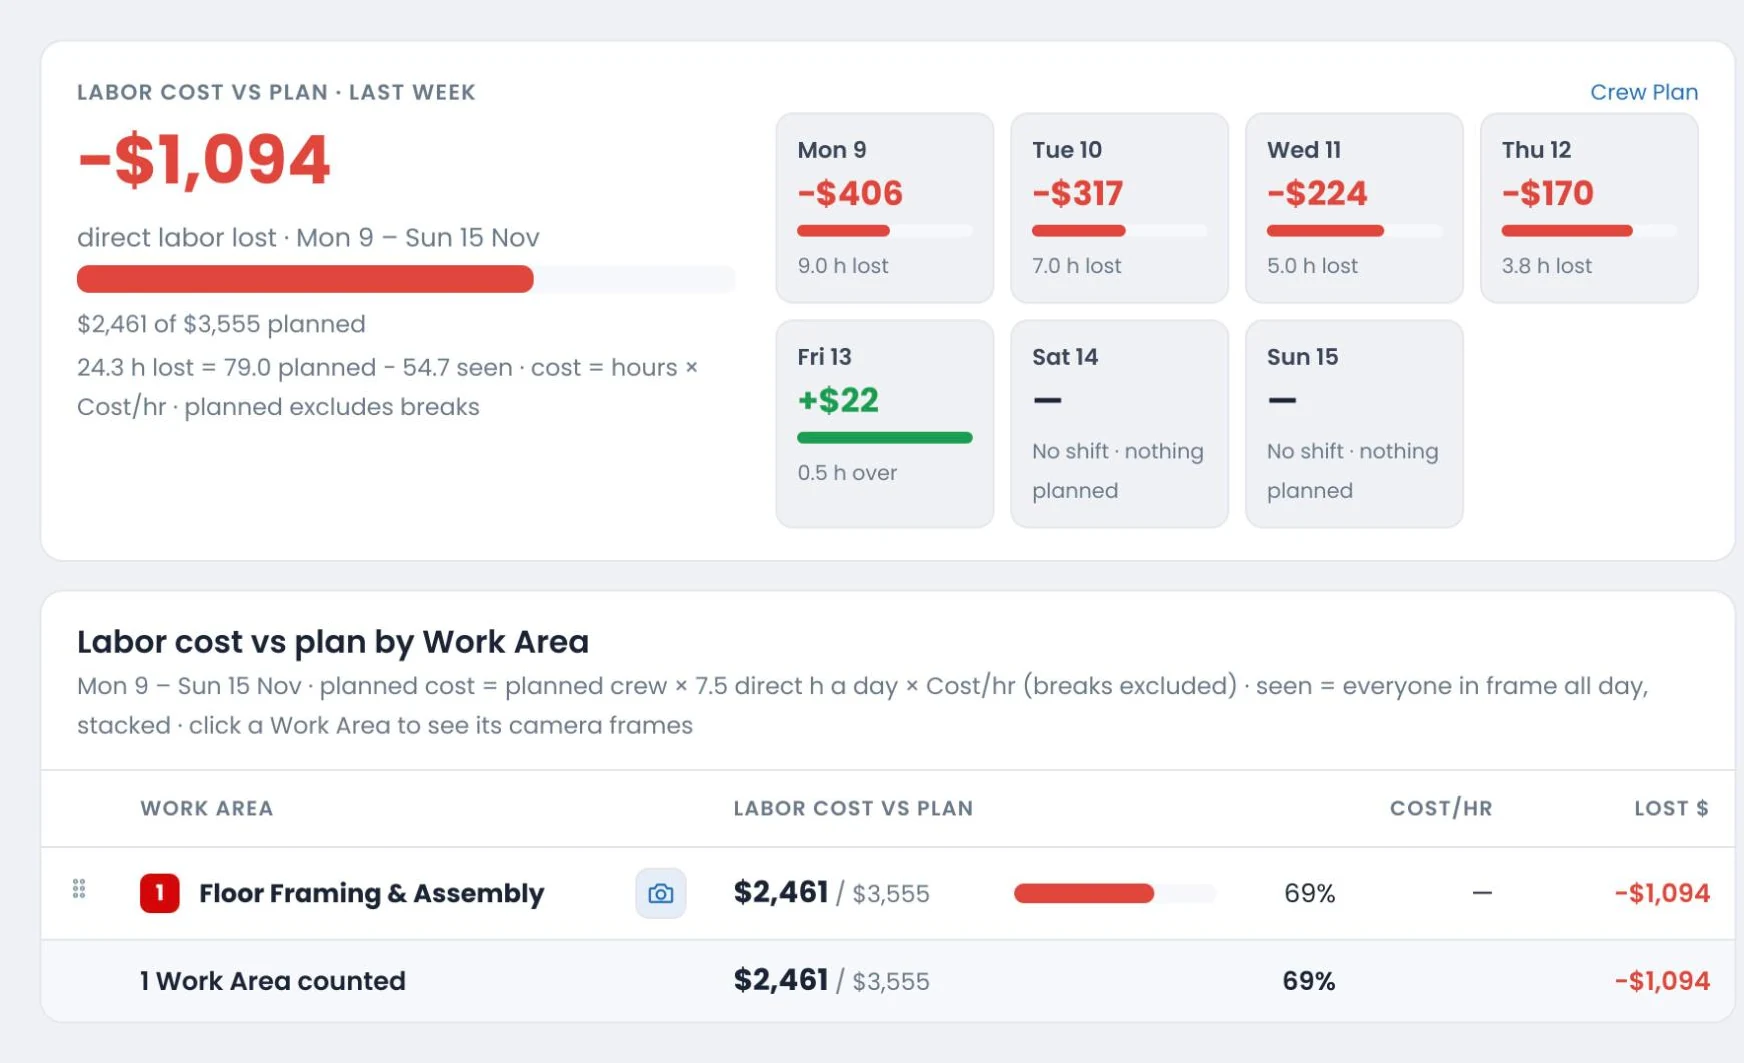
Vision AI counted 54.7 crew hours in the work area against 79.0 planned, counting all crew time in view each day. A timesheet shows who clocked in, not which work area they were in.
24.3 h
net gap between the crew plan and the floor
The week’s planned crew hours minus the hours Vision AI observed. The daily and hour-by-hour views show when the area ran below plan, so a supervisor knows when to rebalance crews.
≈ $1,094
estimated cost of that gap, in one area in one week
Valued at the area’s planned rate of $45 an hour, close to the U.S. manufacturing average of $48.62.1
53% → 103%
daily coverage, Monday to Friday
Observed hours as a share of each day’s plan. The gap showed from Monday, coverage moved closer to plan through the week, and Friday came in just over its plan.
That is one work area, two people, one week. Since then the customer has connected a second camera and work area. Now picture your whole workforce, live, in every work area you can’t see today.
Why workforce management
In our view, people are the most expensive resource you manage.
Materials are bought once, at a price. People are paid by the hour, every hour the plant runs, and where they work decides what each of those hours produces. Yet they are often the resource a plant sees last.
When crews aren’t scheduled or assigned to the right task, output slips quietly: a station runs short, a crew waits on another, people get pulled to the wrong area, a break runs long. Left alone, that becomes lost production, late modules and lost profit.
Strong plants see it during the shift and rebalance crews before the gap costs them, to get maximum output and profit from every paid hour. Struggling plants find out from the month-end report.
$48.62
average employer cost per hour worked in U.S. manufacturing, wages and benefits (June 2026)1
On average, every crew hour costs that much, whether the crew is on the right task or not.
2.6x
output per hour at a plant at the 75th percentile against one at the 25th, in the average U.S. manufacturing industry (2021)2
Same industry, very different output from each hour worked.
1.9 million
manufacturing jobs that could go unfilled by 2033 if the skills and applicant gaps are not closed3
Most plants cannot hire their way to more output. They have to get more from the workforce they already have.
The old way
Legacy workforce management is costly, clunky and disruptive.
The usual answer is a legacy enterprise workforce management system or an ERP add-on, built to record attendance and hours, not to place people during the shift.
- Extremely costly.Licenses, often per user or per device, plus hardware and an implementation project before the first shift sees any value.
- Clunky on the floor.Badge readers, time clocks or terminals installed at every station, and a record of who clocked in, not which work area they are in.
- Very disruptive for operators.A new routine every shift, plus training and a change-management program to make it stick.
Plants without one fall back on timesheets and floor walks. A timesheet records attendance, a floor walk gives a snapshot, and month-end variance comes too late to fix the week. Either way, supervisors key in data when they should be managing the workforce.
65%+
of supervisors waste up to four hours a shift on manual data entry and reconciliation, in a 2026 industry survey of 600+ U.S. manufacturing leaders4
Supervisor time goes into keying in data instead of managing the workforce on the floor.
70%+
of recent ERP initiatives will fail to fully meet their original business case goals by 2027, Gartner predicts5
Big enterprise rollouts often fall short of what they set out to do.
The customer
A project manufacturer manages its workforce with Vision AI.
This manufacturer builds volumetric modules project by project, and every project has its own crew plan: how many people each work area needs, for how many productive hours, at what hourly cost. Profit is decided week by week, not at month-end, by whether the right people are on the right task.
The hard part of managing that workforce is knowing, while the week is still running, how closely the floor matches the plan. A timesheet shows who clocked in. It can’t show whether the framing and assembly area has its two planned people at the table on a Wednesday morning.
See
Vision AI sees, frame by frame and live, how many people are in each work area a camera covers. It counts people. It doesn’t recognize faces and stores no names.
Plan
The crew plan sets how many people each work area needs and what they cost: crew size × productive hours × hourly rate, with breaks excluded.
Compare
Offsight compares crew coverage against the plan automatically, in hours and dollars, by day, work area and week, so supervisors can rebalance crews during the shift.
What operators had to change: nothing.
No one on the floor taps, scans or types anything, so there is nothing new to learn and no disruption to the shift. The plant’s camera sends a still photo of the work area every 30 seconds, and Vision AI does the counting.
- No badges to scan, no codes to punch, no tablet at the station, no new routine.
- Nothing to run on site: no servers or GPUs. Offsight trains and runs the AI.
- Photos are kept for 30 days, so every number traces back to the pictures behind it.
- It runs every shift with no one touching it, and now counts the whole plant day, early starts and overtime included.
A sample week
Visible on Monday, not at month-end.
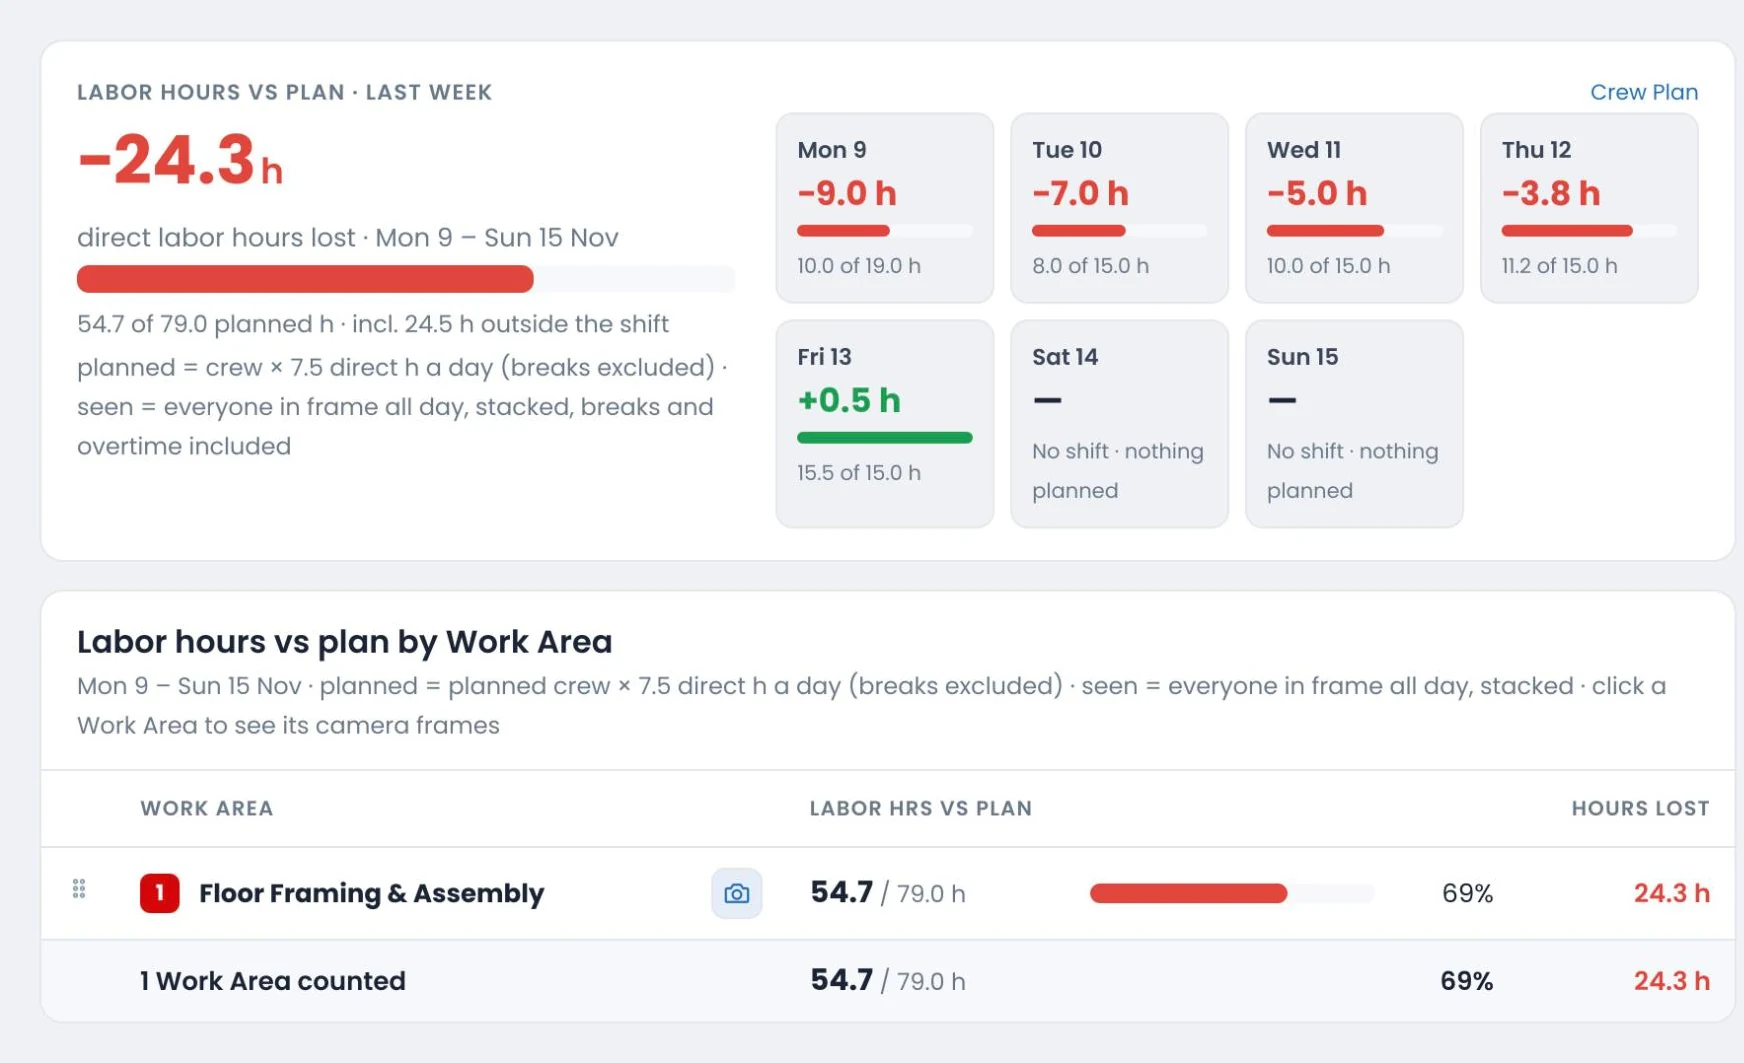
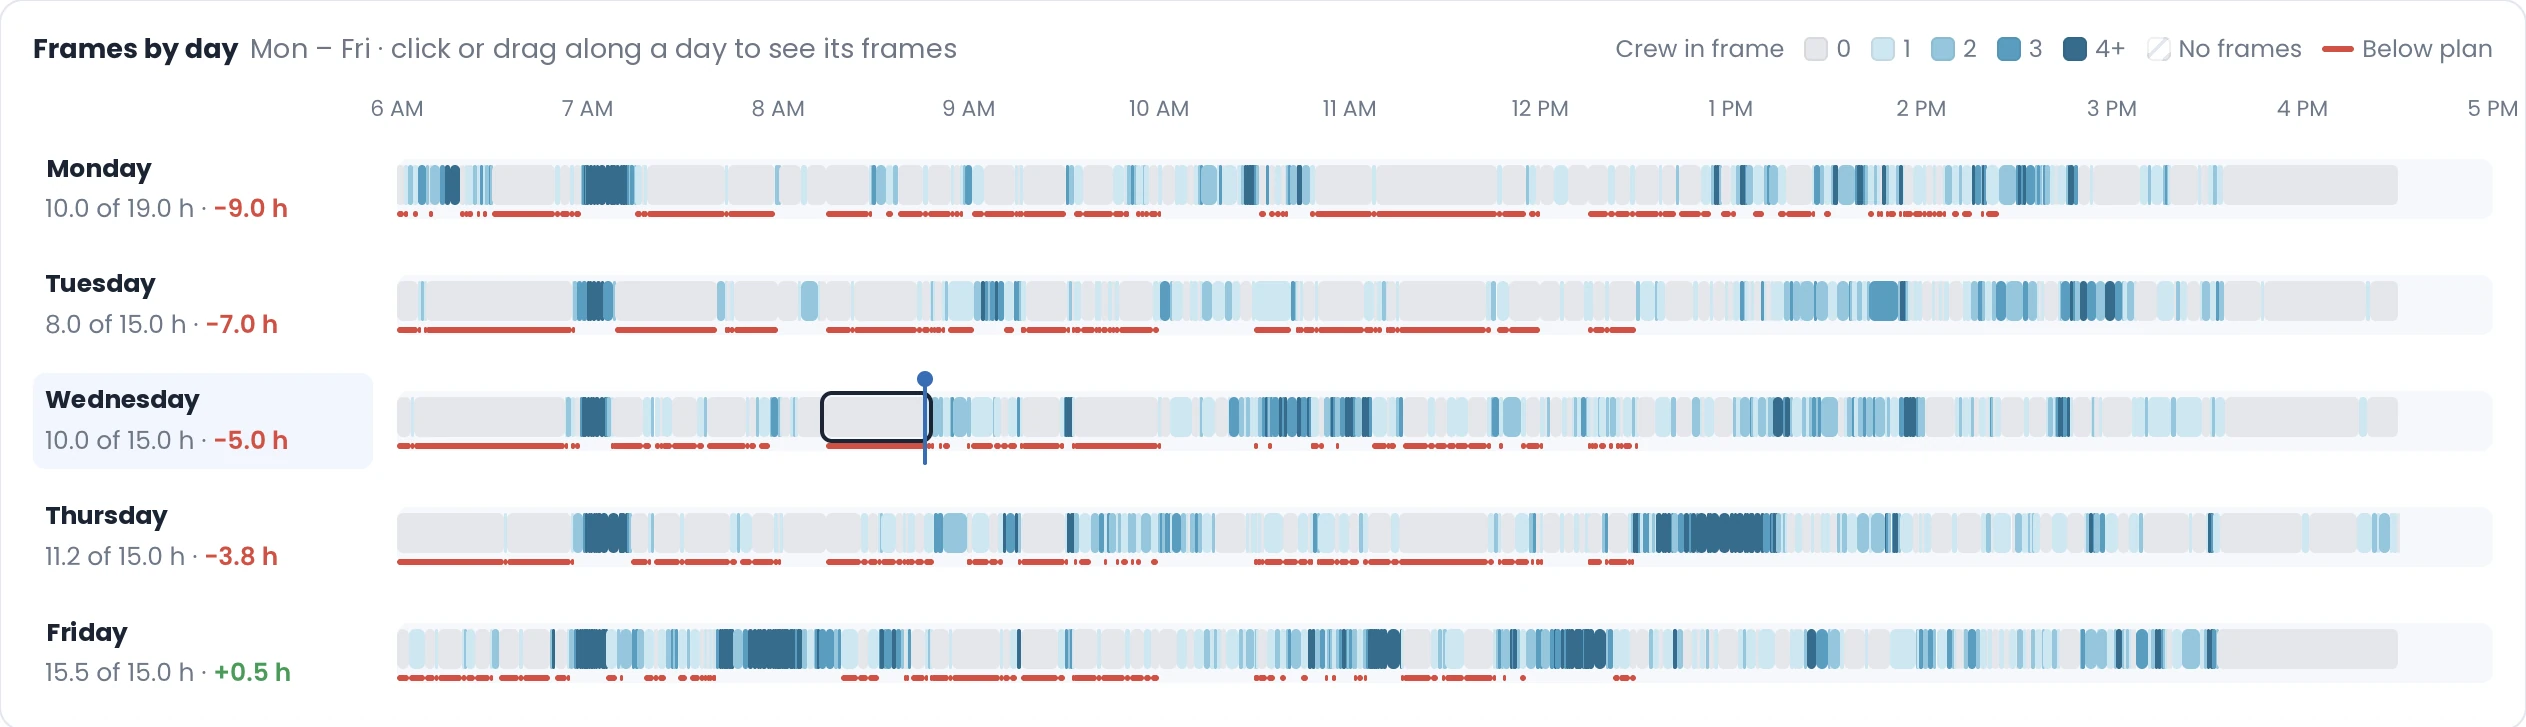
One framing and assembly work area, a planned crew of two, Monday to Friday. Each bar is the crew time Vision AI saw as a share of that day’s plan.
With real-time workforce management, a gap like this shows up on day one, so supervisors can rebalance crews while the week is still running. One week can’t say why Friday hit plan. What it does show is how early a gap can be seen: on Monday, with four working days left to act.
Inside the day
Every gap opens to the photos behind it.
Vision AI lays the week out hour by hour, so a supervisor can see when a work area was short of crew, not only by how much.
One gap, up close
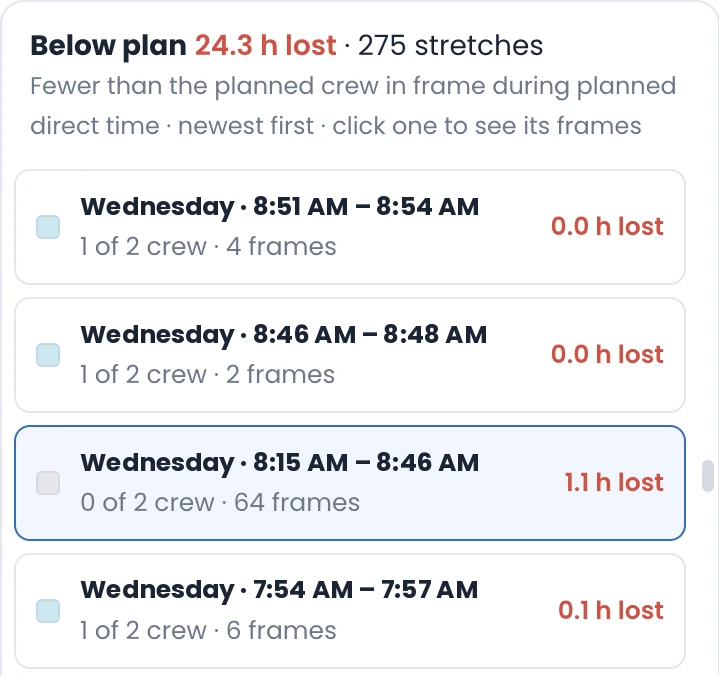
On Wednesday from 8:15 to 8:46 AM, Vision AI counted none of the area’s two planned crew members in any of the 64 photos it took, one every 30 seconds. That one stretch accounts for 1.1 crew hours.
Across the week, Vision AI flagged 275 moments when the station had fewer people than planned. Each one opens to its photos, so a supervisor can ask the right question the same day:
- Did a break run past plan?
- Was material late?
- Was the crew pulled to another area?
The answer decides the workforce call: re-time a break, move people to the bottleneck, or fix tomorrow’s plan.
Why Offsight Vision AI
Real-time workforce management, without the enterprise rollout.
Large manufacturers that have adopted smart manufacturing report, on average, a 7% to 20% improvement in employee productivity.6
Offsight brings real-time workforce management to the floor with cutting-edge AI: Vision AI counts the crew in every work area your cameras cover, live, against the crew plan, with nothing new for operators to learn.
That is where nearly instant ROI can come from: from the first week, supervisors can make better workforce decisions, such as rebalancing crews, moving people to the bottleneck, re-timing a break or fixing tomorrow’s plan, so a plant gets more output and profit from the hours it already pays for.
| Legacy enterprise workforce management system | Offsight Vision AI | |
|---|---|---|
| What you see | Who clocked in, not which work area they are in right now | How many people are in each work area against the crew plan, live |
| On the floor | New hardware at every station: badge readers, time clocks or terminals | Cameras: the ones you already run, or off-the-shelf models |
| For operators | A new routine every shift, plus training and a change-management program | Nothing new. No badges, no taps, no codes. People just work. |
| Data entry | Scanned or typed every shift, and only as good as what gets entered | None. Cameras and AI count every shift. |
| Getting started | An implementation project: hardware, integration and training | Cameras connect in minutes, and a work area learns from three labeled photos per camera |
| On site | Servers, integrations and IT support | No servers or GPUs. Offsight trains and runs the AI. |
| Evidence | A number in a report | Every number opens to its photos, kept for 30 days |
| Pricing | Licenses, often per user or per device, plus the implementation | By usage, with unlimited cameras and users. See pricing |
| Return | Only after the rollout and the adoption program | Nearly instant: better workforce decisions from the first week |
Every week, every work area
A weekly workforce loop that keeps closing the gap.
The sample week is one turn of a loop that runs every week, on every work area the cameras cover. Over the weeks, the same data shows day-of-week patterns, recurring quiet periods and staffing peaks, whether gaps narrow, and what crew size and timing the work really needs, so the next crew plan puts the right people on the right task.
Measure
See crew coverage live against the crew plan, in every work area the cameras cover.
Review
Spot the days, hours and work areas that run understaffed or overstaffed against plan.
Rebalance
Move people to the bottleneck, re-time breaks and resequence work while the week is running.
Repeat
Compare with last week and build the next crew plan on what the floor really needed.
Who it helps
- Operations managersPut the right people on the right task across projects and work areas, and protect output and margin before gaps become cost overruns.
- Supervisors and crew leadsSee crew coverage against plan during the shift, ask why an area is short, and rebalance crews on the spot.
- CFOs and controllersSee what workforce gaps cost as labor-cost variance by day and work area, with 30 days of photos as evidence.
Manage your workforce in real time, starting with one camera.
See your first week of crew coverage against plan, with nothing new for operators. No data entry, no facial recognition, no names.
The full data: every number from the study
Day by day
| Day | Observed | Planned | % of plan | Gap |
|---|---|---|---|---|
| Monday | 10.0 h | 19.0 h | 53% | −9.0 h |
| Tuesday | 8.0 h | 15.0 h | 53% | −7.0 h |
| Wednesday | 10.0 h | 15.0 h | 67% | −5.0 h |
| Thursday | 11.2 h | 15.0 h | 75% | −3.8 h |
| Friday | 15.5 h | 15.0 h | 103% | +0.5 h |
By the numbers
| What | Number | What it means |
|---|---|---|
| Planned crew hours | 79.0 h | From the crew plan: 19.0 h on Monday, which used a longer planned shift, and 15.0 h a day Tuesday to Friday. Two people, breaks excluded. |
| Observed crew hours | 54.7 h | Crew time in the work area’s camera view across the whole plant day, counted by Vision AI with no data entry. It includes any time in view outside the planned shift. |
| Share of plan observed | 69% | Observed crew hours equal to 69% of planned: 54.7 against 79.0 h, counting all crew time in view each day. |
| Net weekly gap | 24.3 h | Planned minus observed hours: 24.8 h below plan Monday to Thursday, and 0.5 h over plan on Friday. |
| Estimated cost of the gap | ≈ $1,094 | 24.3 h × $45 an hour, the area’s planned rate in the crew plan ($1,093.50). One area, one week. |
| Daily coverage | 53% → 103% | Monday to Friday. The gap was visible from the first day. |
| Below-plan stretches | 275 | Moments with fewer than the planned crew in view during planned working time. Each one opens to its photos. |
| Wednesday spotlight | 31 min · 0 of 2 crew | 8:15 to 8:46 AM: 64 photos, one every 30 seconds, and 1.1 crew hours below plan. |
| Planned crew | 2 people | One framing and assembly work area, seen by one camera. |
About this study
- Data: Offsight Vision AI, one framing and assembly work area seen by one camera, with a planned crew of two, Monday to Friday. Planned hours come from the customer’s crew plan (direct time, breaks excluded). Observed hours are crew time in the camera’s view, counted by Vision AI; time spent outside that view isn’t counted.
- Observed hours cover the whole plant day, so they include crew time in view before or after the planned shift. The 69% and the 24.3 h gap compare the week’s totals (54.7 observed against 79.0 planned hours), not hours inside the planned shift. Below-plan stretches are counted only during planned working time.
- Monday’s plan used a longer shift than Tuesday to Friday (19.0 against 15.0 planned hours), which is part of why Monday reads lowest. Below-plan stretches depend on the shift times set in the crew plan.
- Gap cost uses the planned hourly rate in the crew plan: 24.3 h × $45 = $1,093.50, shown as about $1,094.
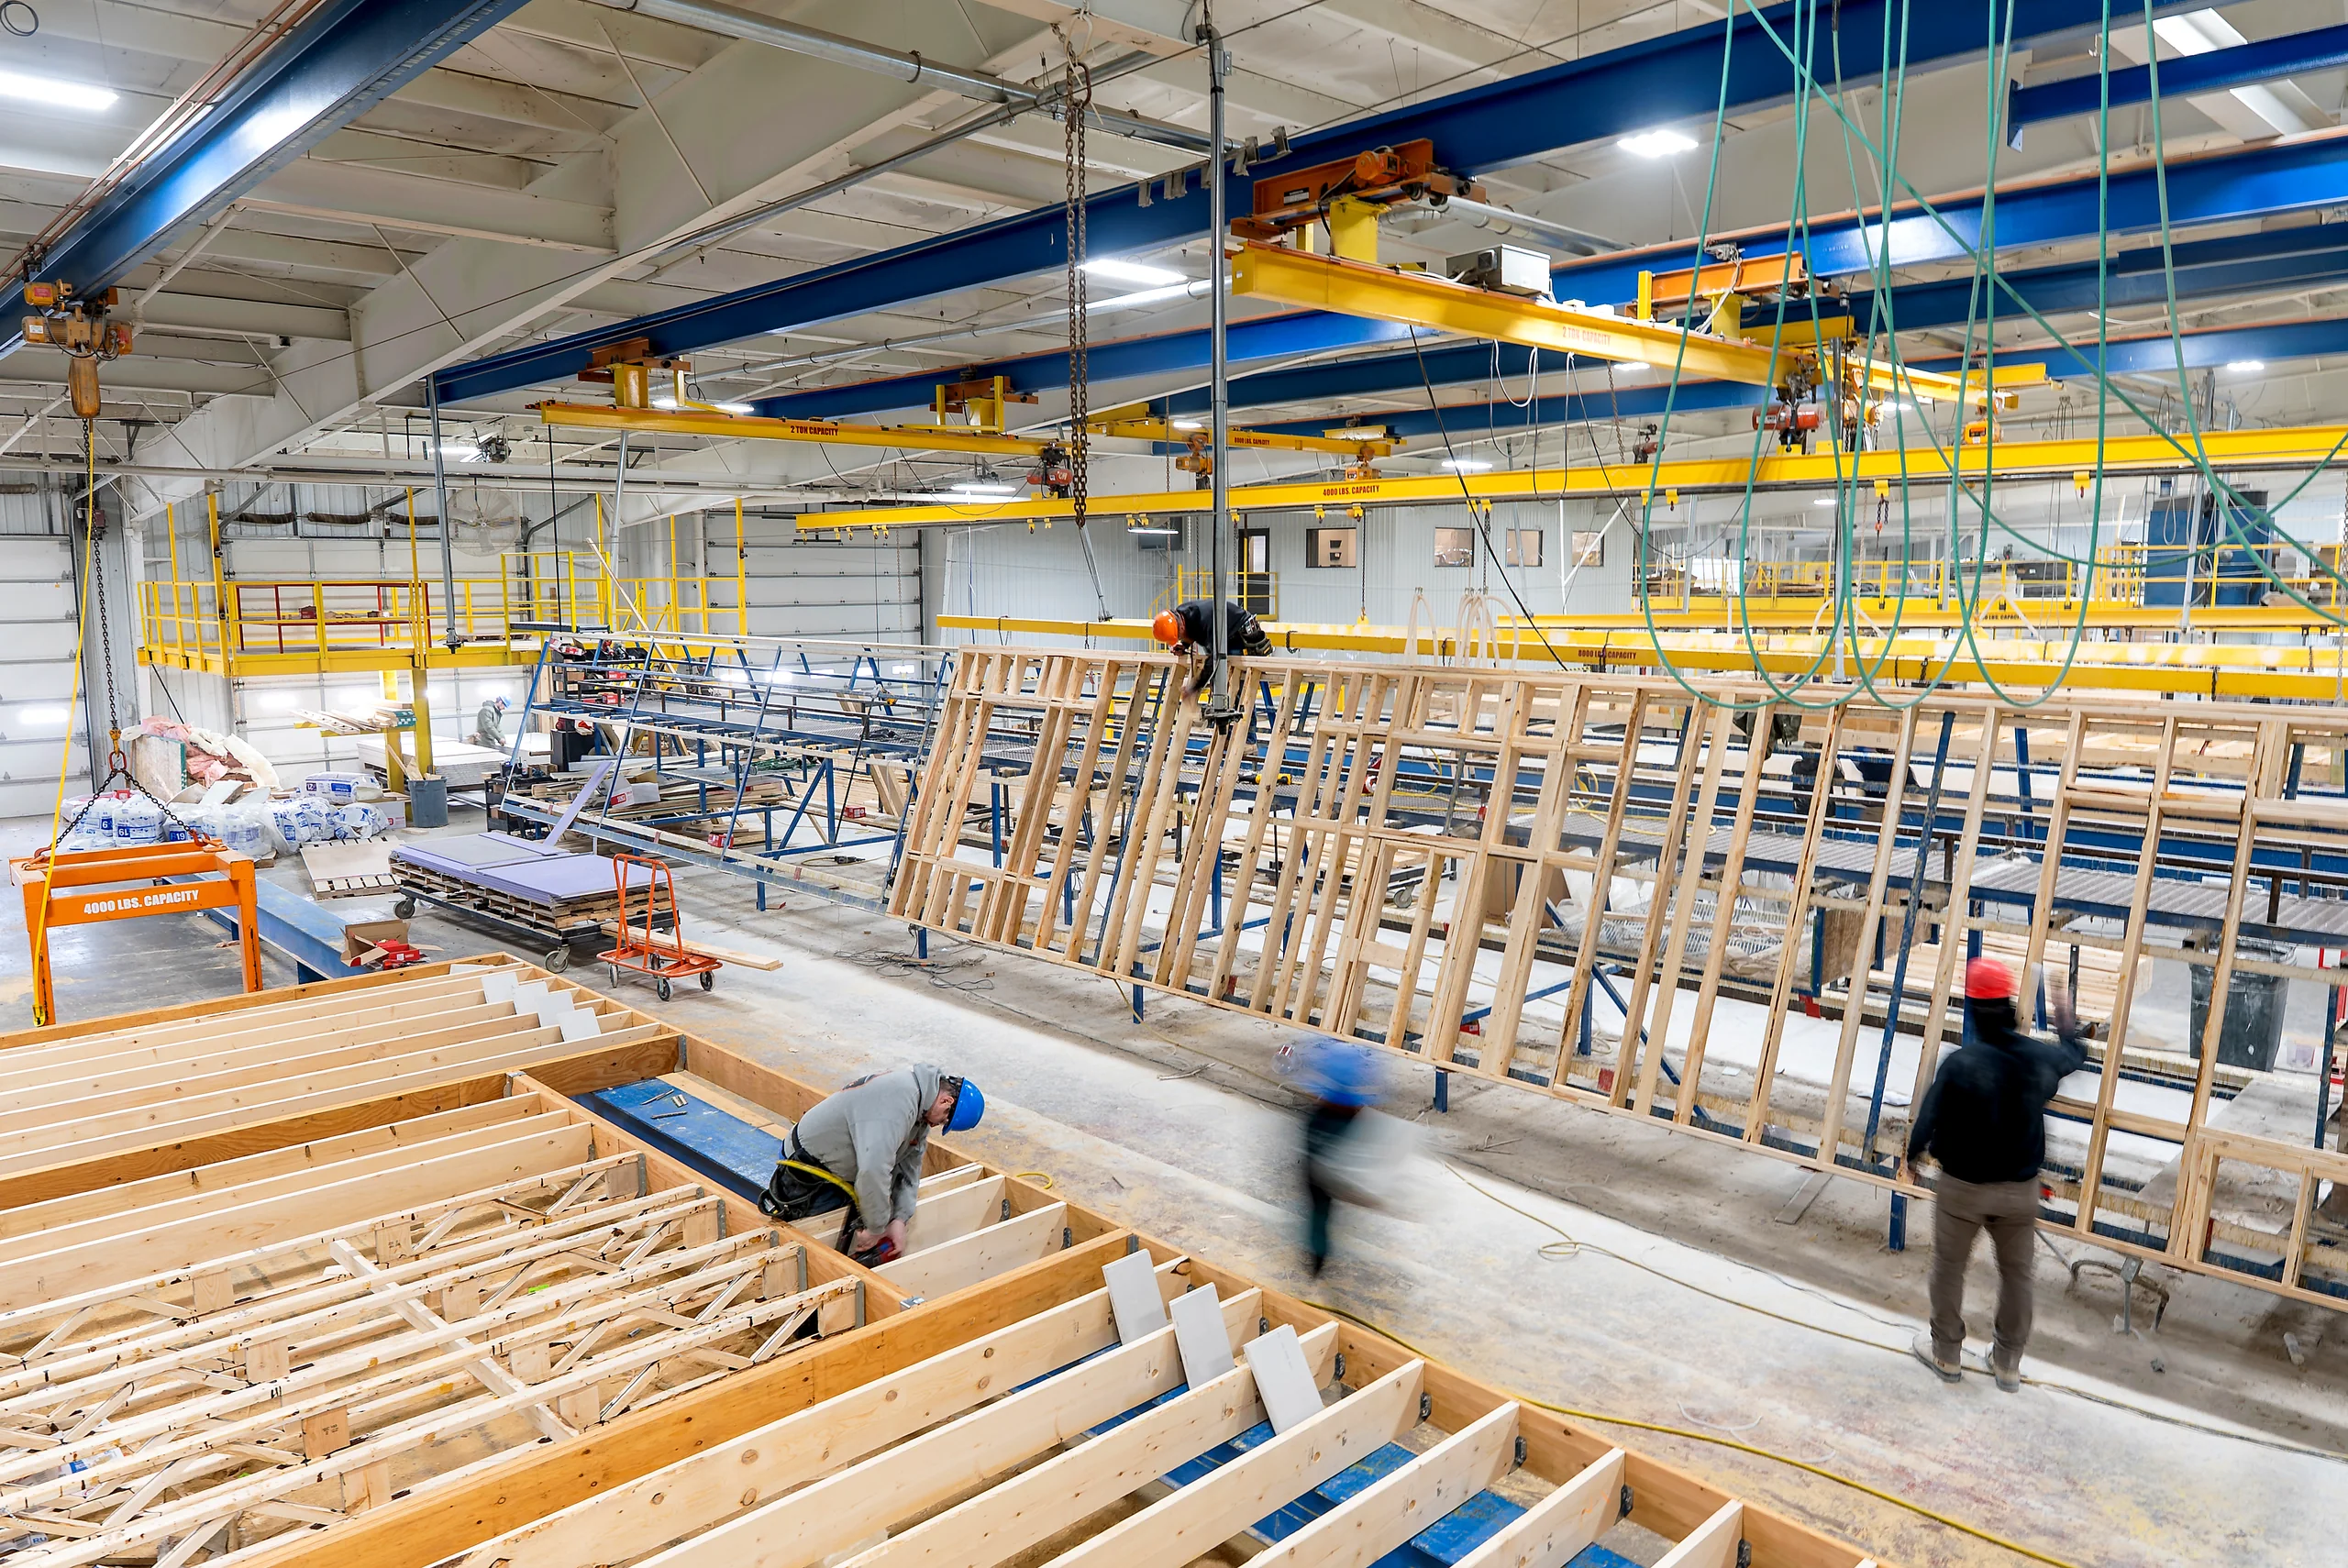
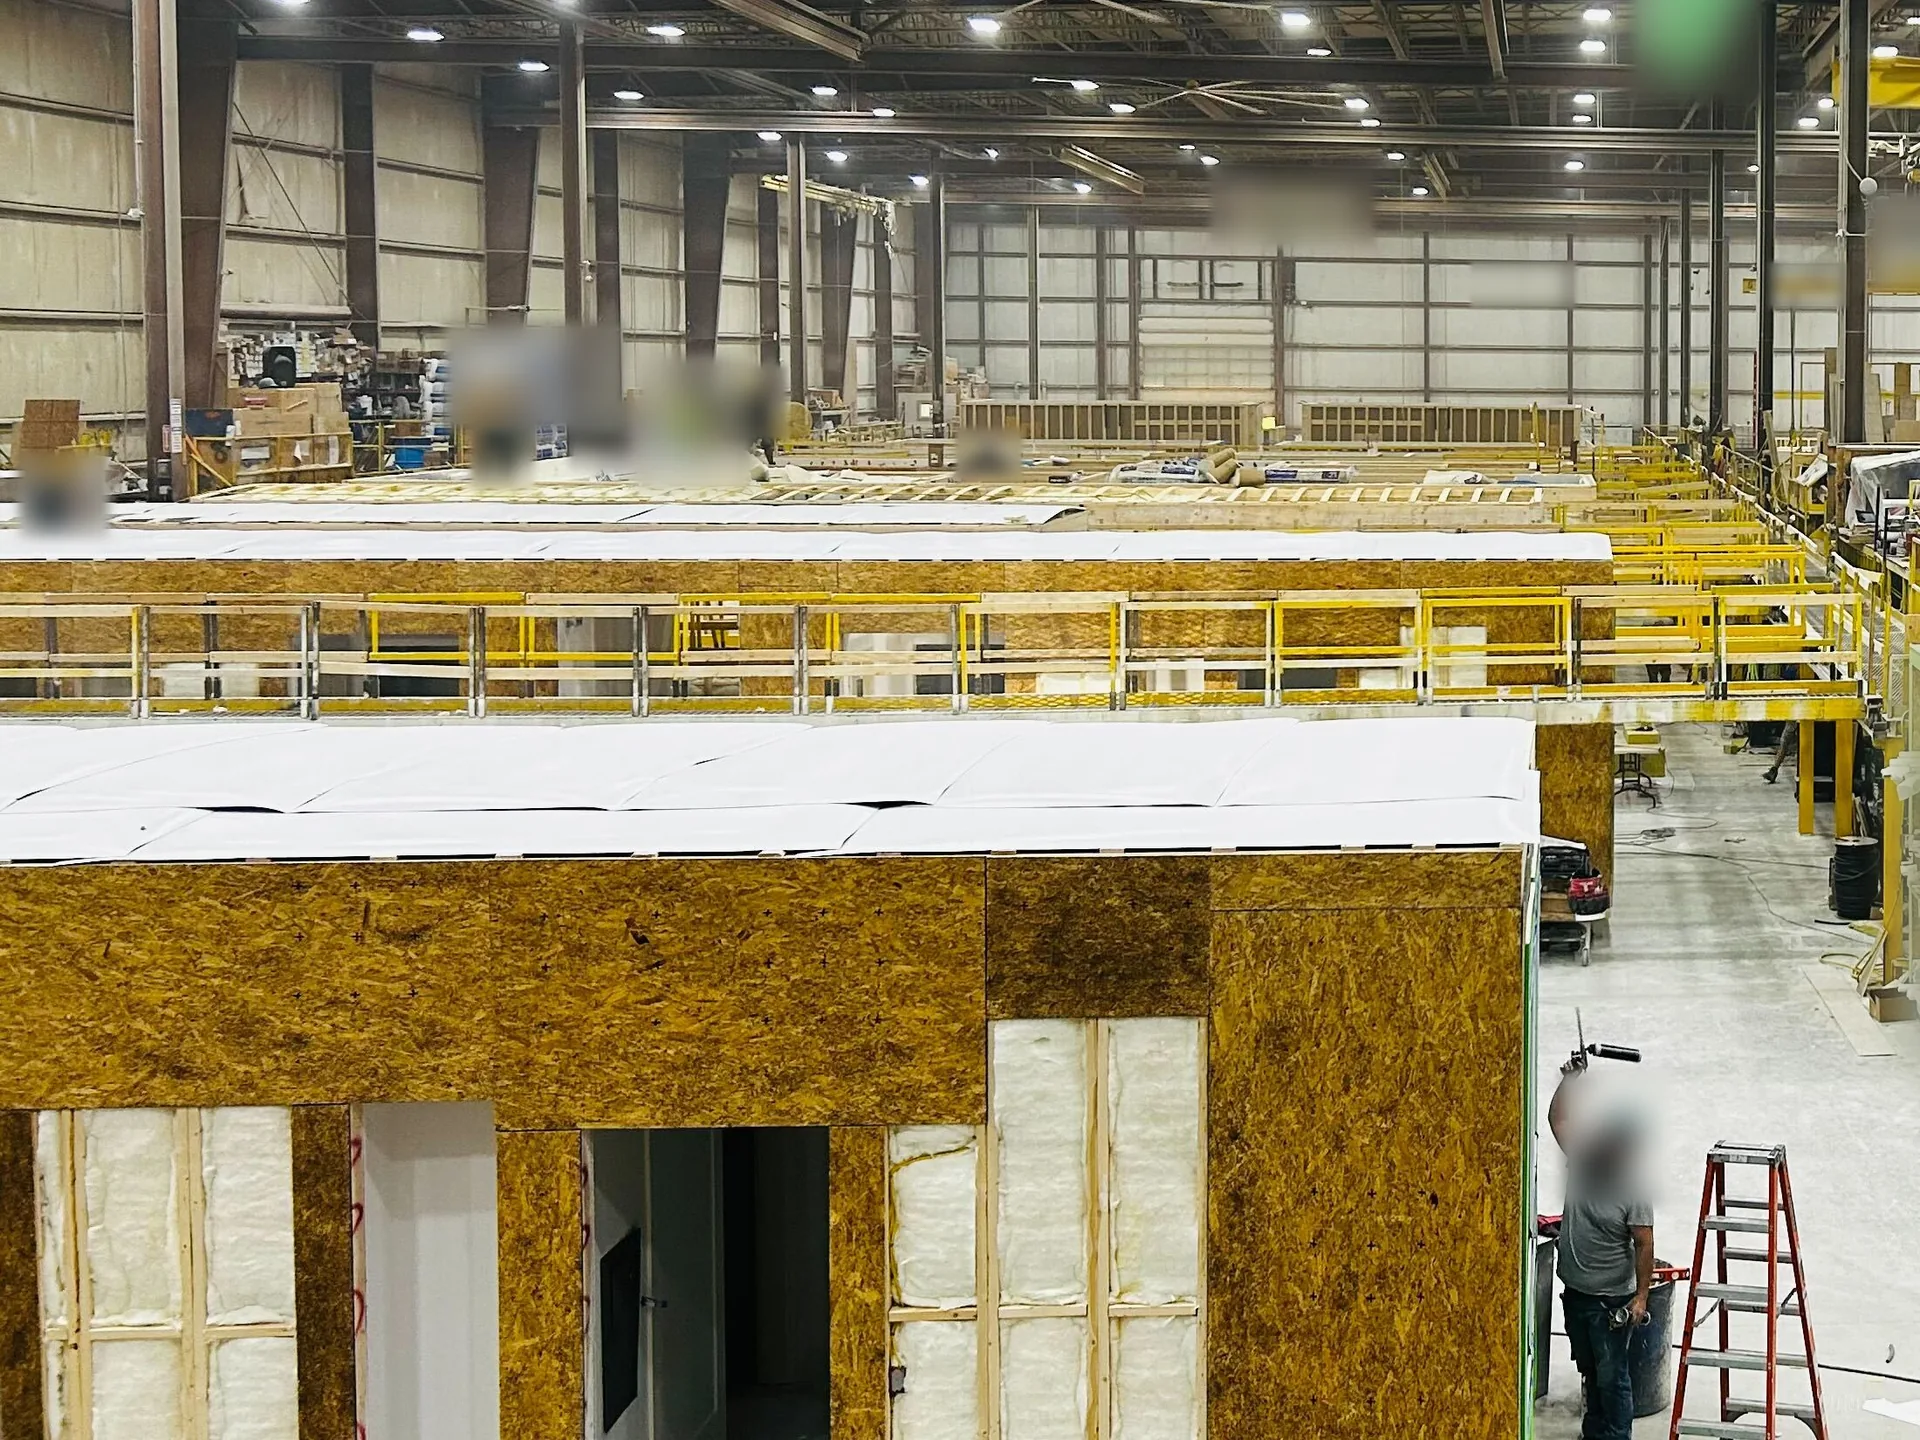
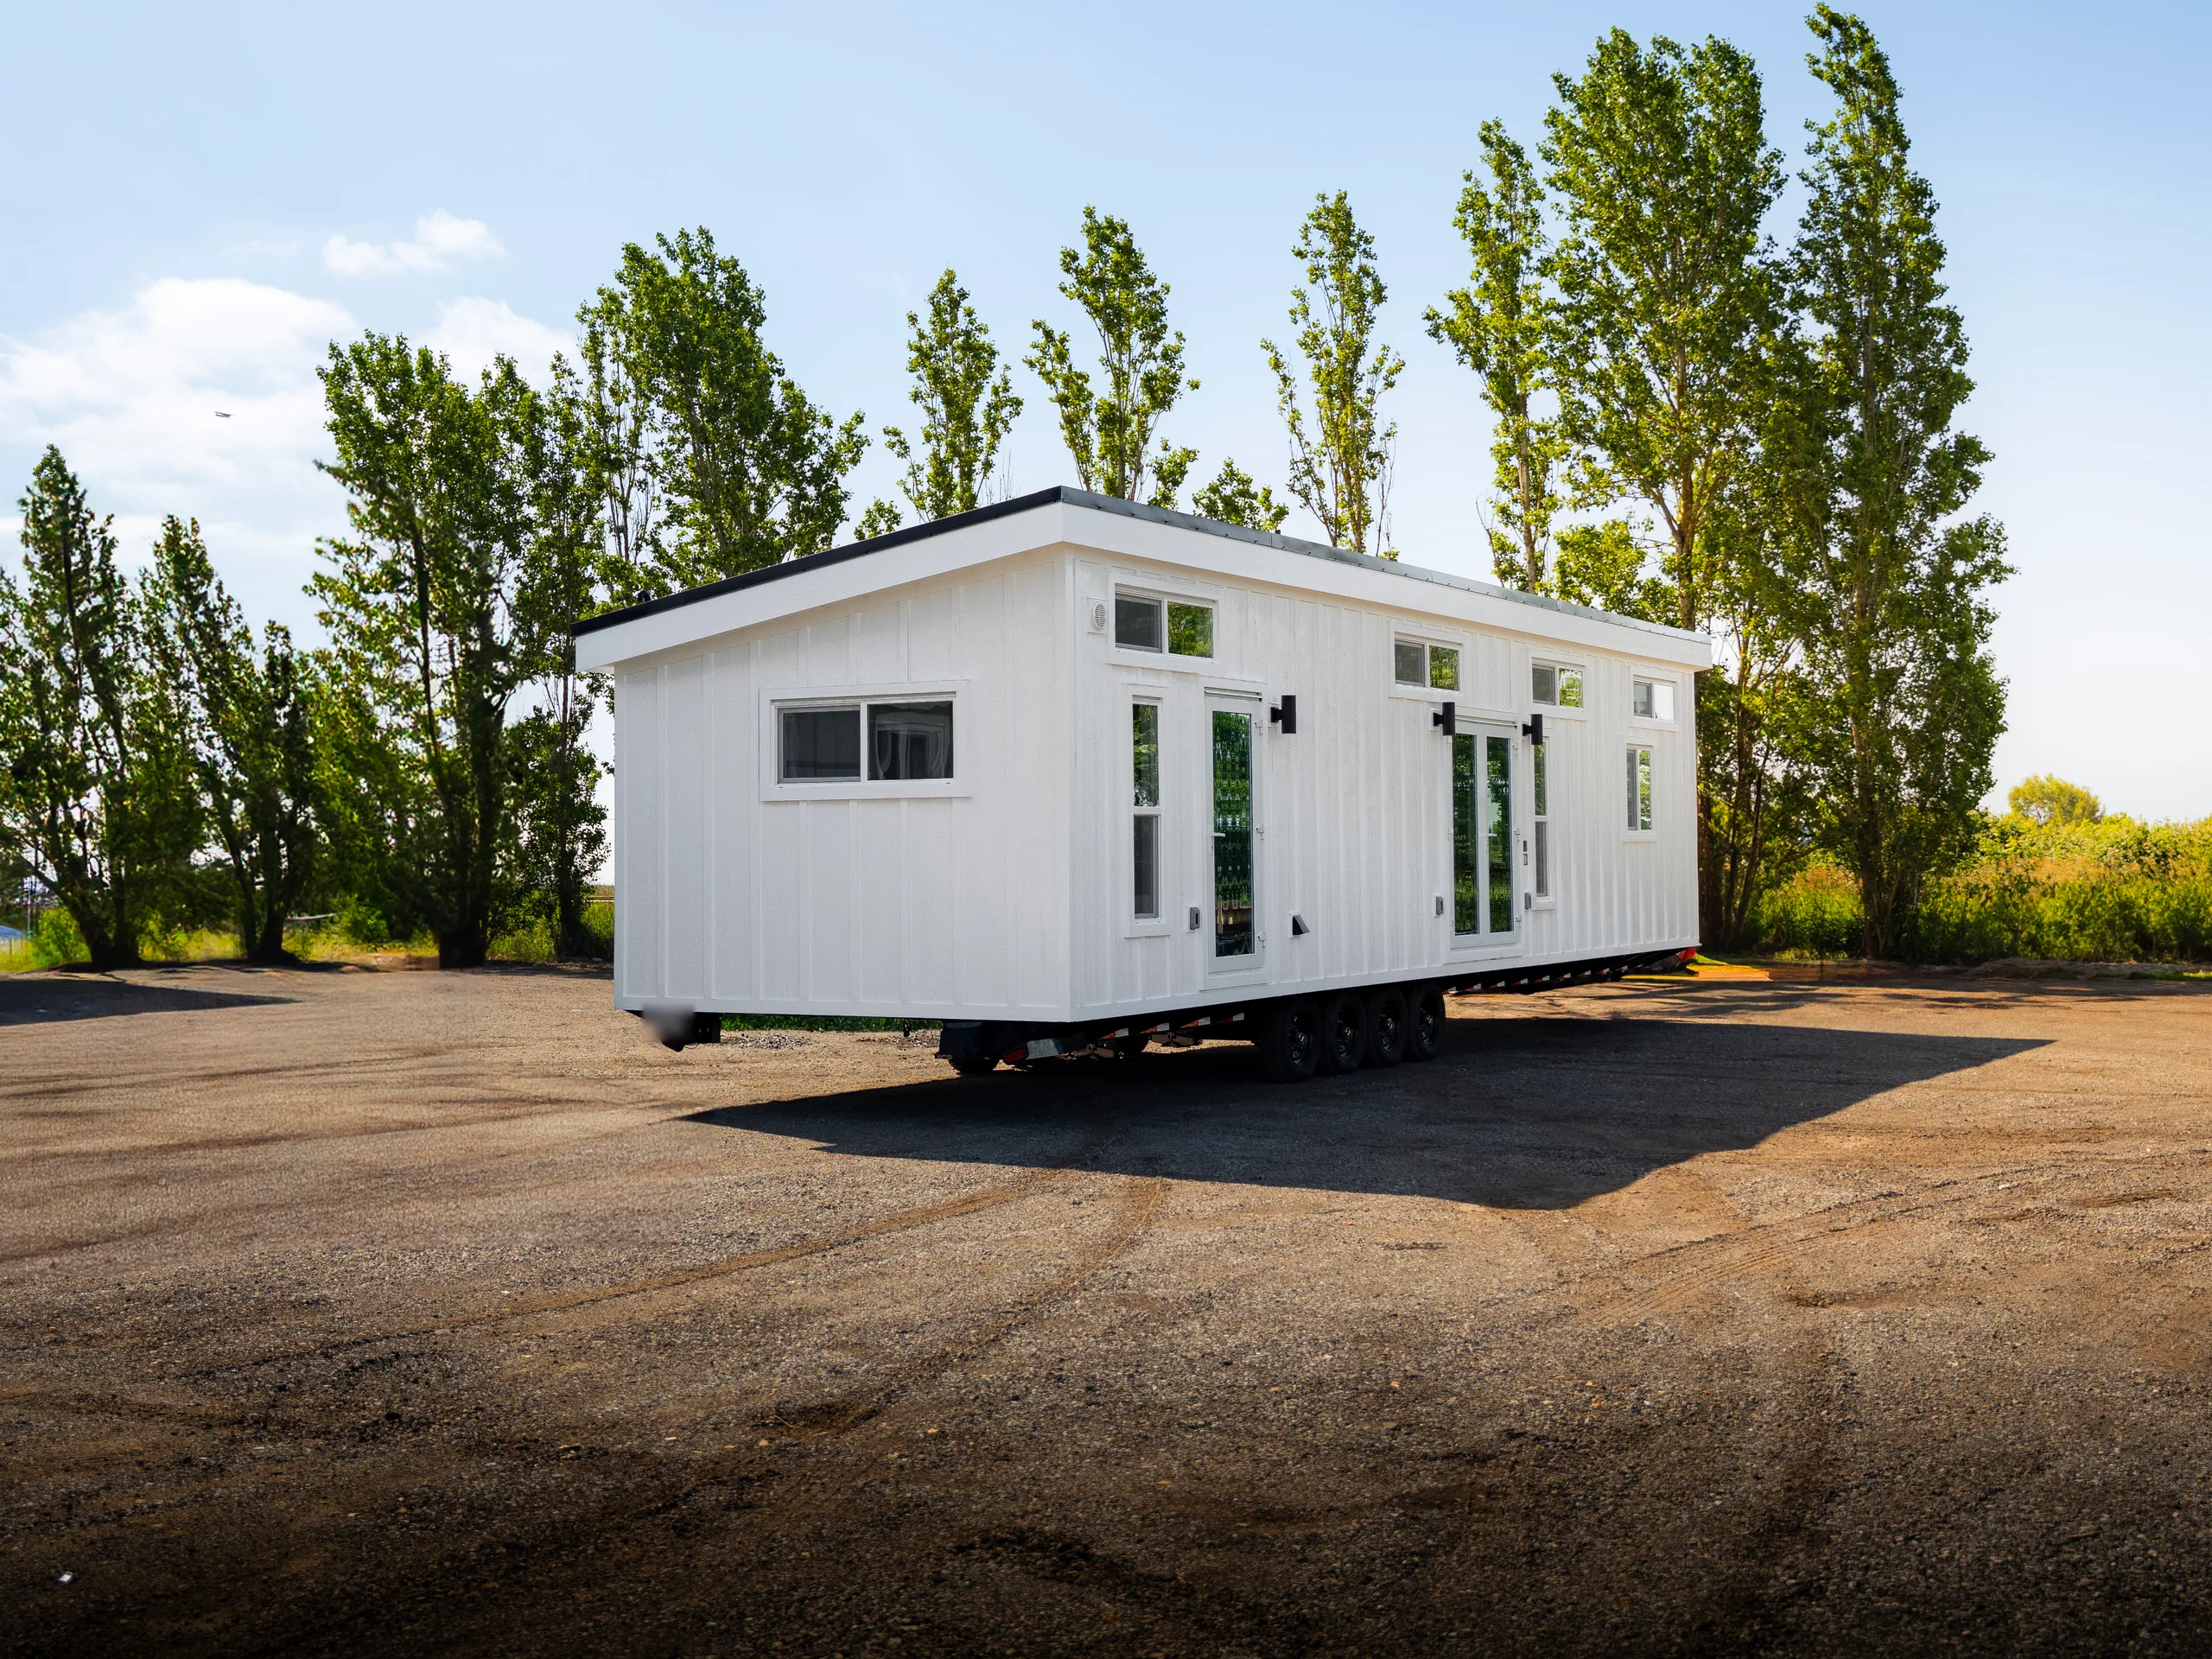
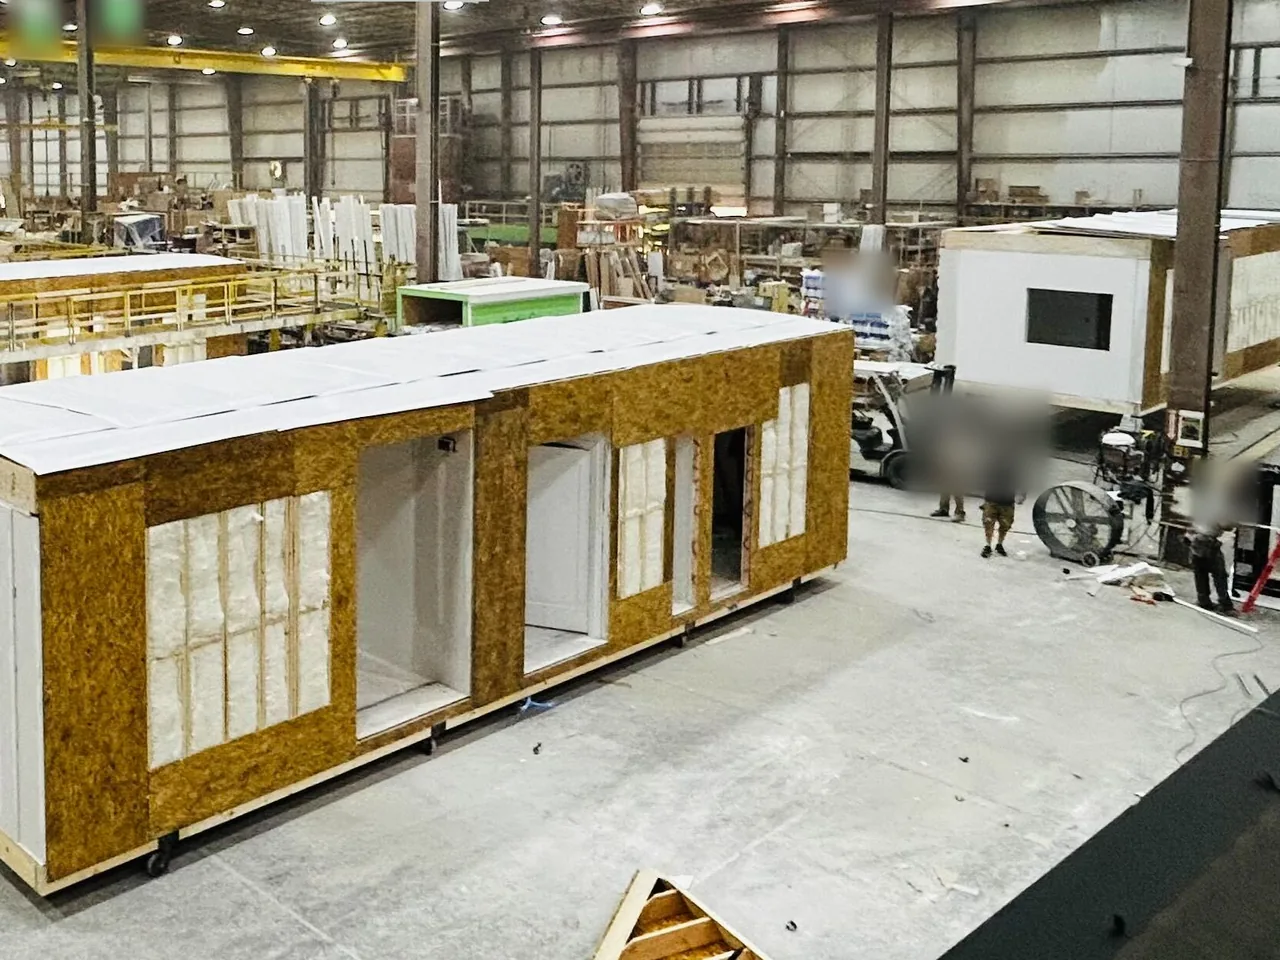
- The customer is not named. Product screens show its data with nothing that identifies it. Photos show representative modular factory floors, not this customer’s plant.
- Outside figures come from the sources below. Lines marked “in our view” are Offsight’s opinion.
Sources
- U.S. Bureau of Labor Statistics, Employer Costs for Employee Compensation, Table 4, June 2026: manufacturing total compensation $48.62 per hour worked ($32.50 wages and salaries, $16.12 benefits). bls.gov
- U.S. Bureau of Labor Statistics and U.S. Census Bureau, Dispersion Statistics on Productivity, 2021 data: in the average manufacturing industry, establishments at the 75th percentile were about 2.6 times as productive as those at the 25th percentile. bls.gov
- Deloitte and The Manufacturing Institute, “Taking Charge: Manufacturers Support Growth with Active Workforce Strategies” (April 3, 2024): as many as 3.8 million manufacturing jobs could be needed between 2024 and 2033, and 1.9 million could remain unfilled if the skills and applicant gaps are not addressed. themanufacturinginstitute.org
- L2L, a manufacturing software company, survey of more than 600 U.S. manufacturing leaders (May 19, 2026): over 65% of supervisors waste up to 4 hours per shift on manual data entry and reconciliation. l2l.com
- Gartner prediction (2024), as reported by TechTarget, “Why ERP initiatives struggle to deliver business value” (June 11, 2026): by 2027, more than 70% of recent ERP initiatives will fail to fully meet their original business case goals. techtarget.com · Gartner
- Deloitte Insights, “2025 Smart Manufacturing Survey” (May 1, 2025): 600 executives at U.S. manufacturers with $500 million or more in revenue and more than 1,000 employees reported, on average, a 7% to 20% improvement in employee productivity since implementing smart manufacturing. deloitte.com
Customer data: Offsight Vision AI, from the customer’s own account (one work area, one week).